


Zabbix version 7.0 has arrived, and with it, a new monitoring concept is gaining traction: synthetic monitoring.
Synthetic monitoring aims to further expand the visibility we have when monitoring web pages and applications. No more just receiving an HTTP error code XYZ or a comment like, “Oh, but that feature is taking too long to load.” Now, along with that information, we can include a screenshot of what the page actually looked like at the moment the problem occurred and truly see what our customer was seeing.
This monitoring is possible thanks to a little bit of JavaScript and a good dose of Selenium WebDriver.
WebDriver – Selenium is an automation tool for testing web applications. It allows you to control a web browser programmatically (this is where JavaScript comes in), interacting with page elements, filling out forms, clicking buttons, and verifying the application’s behavior. Ideal for automated and repetitive testing.
To use this monitoring in Zabbix, we’ll need to work on two fronts. The first is in the front-end itself, where we’ll configure the host, link the template, and set up the macros according to what you want to monitor—this is the simple part. The second step is in the CLI: we need to tell Zabbix the URL of the WebDrive it will use, and we need to instantiate the collectors that will perform synthetic monitoring.
Let’s get down to business, then. First, make sure you’re running Zabbix version 7.0. Due to various dependencies related to the Zabbix architecture, this monitoring will only work starting with version 7.0.
Next, you’ll need to have the template in your Zabbix installation, which you can download here: https://git.zabbix.com/projects/ZBX/repos/zabbix/browse/templates/app/website_browser
So all you have to do is create a host, link the template, and populate the macros inherited from the host as follows:
- {$WEBSITE.BROWSER} – Browser to be used for data collection.
- {$WEBSITE.DOMAIN} – The URL that will be used
- {$WEBSITE.GET.DATA.INTERVAL} – How often will monitoring take place?
- {$WEBSITE.NAVIGATION.LOAD.MAX.WARN} – The time, in seconds, that the browser has to respond before it is considered an incident
- {$WEBSITE.PATH} – If you need to access a path other than the site’s root directory (/). For example: https://zabbix.made4it.com.br/zabbix/index.php; in this case, the path would be: /zabbix
- {$WEBSITE.RESOURCE.LOAD.MAX.WARN} – The time, in seconds, that page resources have to respond before it is considered an incident
- {$WEBSITE.SCHEME} – Whether HTTP or HTTPS will be used
- {$WEBSITE.SCREEN.HEIGHT} – Screenshot height
- {$WEBSITE.SCREEN.WIDTH} – Screenshot width
After entering the macros and creating the item, we now need to go to the server’s CLI to complete the installation.
In the server’s CLI, we need to edit the zabbix_server.conf file and set the following variables (they are usually at the end of the file)
WebDriverURL = What is the URL that provides access to Selenium?
And
StartBrowserPollers = Number of pollers that will be used to collect browser-type items
If you install Selenium locally, you can set the variable as follows:
WebDriverURL=http://localhost:4444
As for the number of pollers, we can start with 1 and increase it as needed: StartBrowserPollers=1
An easy way to install Selenium is to run it in a container. To do this, we first need to install Docker Engine on our server, and then configure the Selenium container. We can use two commands for this:
- curl -fsSL https://get.docker.com -o get-docker.sh
This first command is a script that automatically installs Docker Engine on your server.
- docker run -d -p 4444:4444 -v /dev/shm:/dev/shm –restart unless-stopped selenium/standalone-chrome:latest
And the second command is to configure the Selenium container on your server.
To view the container’s status, you can use the command
- Docker container ls –a

Once the container is configured, simply restart the Zabbix Server service so that it can read the new variables and be ready to use Selenium and perform monitoring.
Going back to the front end, we can then go to the dashboard for the host we just monitored, and the expected result is:
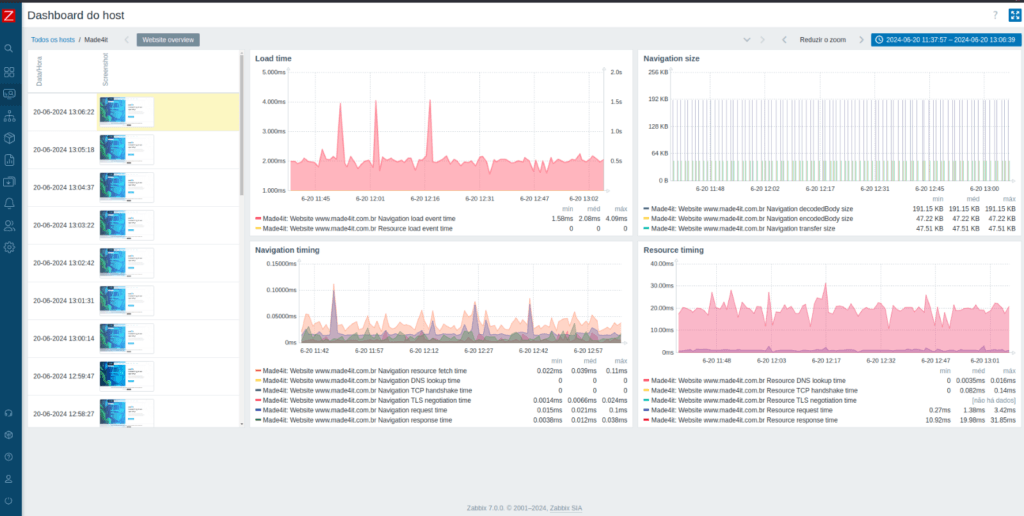
Explanation of each of the monitored items:
- Load time:
- Webzada: Website www.made4it.com.br Navigation load event time: Represents the total page load time, including all events from the start of navigation until the page finish loading.
- Webzada: Website www.made4it.com.br Resource load event time: Indicates the total time it takes to load all resources (images, scripts, CSS, etc.) required for the page.
- Practical example on YouTube: The total time it takes for the YouTube homepage to load completely, including recommended videos, menus, the search bar, etc.
- Navigation size:
- Webzada: Website www.made4it.com.br Navigation decodedBody size: The size of the decoded body of the response—that is, the size of the data that was actually transferred and decoded.
- Webzada: Website www.made4it.com.br Navigation encodedBody size: The size of the response’s encoded body, which is the size of the data before it is decoded.
- Webzada: Website www.made4it.com.br Navigation transfer size: The total size of the data transferred during navigation, including headers and the response body.
- Practical example on YouTube: The total amount of data transferred when loading the YouTube homepage, including all visual elements, scripts, and other resources.
- Navigation timing:
- Webzada: Website www.made4it.com.br Navigation resource fetch time: Time taken to retrieve navigation resources.
- Webzada: Website www.made4it.com.br Navigation DNS lookup time: Time spent on DNS resolution.
- Webzada: Website www.made4it.com.br TCP handshake time: The time taken for the TCP handshake, which is the process of establishing a TCP connection between the client and the server.
- Webzada: Website www.made4it.com.br TLS negotiation time: The time spent on TLS negotiation, which is the process of establishing a secure connection.
- Webzada: Website www.made4it.com.br Navigation request time: The time from the start of the request to the server’s response.
- Webzada: Website www.made4it.com.br Navigation response time: The server’s response time after the request is sent.
- Practical example on YouTube: The time it takes for the browser to resolve the YouTube address (DNS lookup time), establish a TCP connection (TCP handshake time), negotiate a secure connection (TLS negotiation time), request page resources (request time), and receive a response from the server (response time).
- Resource timing:
- Webzada: Website www.made4it.com.br Resource DNS lookup time: Time spent resolving DNS for individual resources.
- Webzada: Website www.made4it.com.br Resource TCP handshake time: Time spent on the TCP handshake for individual resources.
- Webzada: Website www.made4it.com.br Resource TLS negotiation time: Time spent on TLS negotiation for individual resources.
- Webzada: Website www.made4it.com.br Resource request time: The time it takes to request individual resources.
- Webzada: Website www.made4it.com.br Resource response time: Response time for individual resources.
- Practical example on YouTube: The time it takes for each resource (image, video, script, etc.) needed to load the YouTube homepage to be requested, responded to, and loaded in the browser.
Charts and Statistics
Each graph shows how the metrics change over time, allowing you to identify patterns and potential performance bottlenecks. The minimum (min), average (avg), and maximum (max) values help you understand the distribution of the metrics:
- Load time shows the variation in the total load time for the page and its resources.
- “Navigation Size ” details the size of the transferred data, showing the efficiency of the data transfer.
- Navigation timing highlights the different times involved in navigation, helping you identify which steps in the navigation process are taking the longest.
- Resource timing focuses on the load times of individual resources, helping to identify specific resources that may be causing slowdowns.
These metrics are essential for monitoring website performance and identifying issues that could affect the user experience.