
Our Made4graph software has several screens that help internet providers in managing the PPoE client, to better understand where the need for made4graph comes from, check out this content where we present what the tool is
Here we are going to navigate through the tool to get to know each of the main screens better, how they work and what information they present.
In Made4Graph, which is accessible via the WEB, on the initial screen we have an Overview of the status of the network as a whole. Upon entering the software, we are faced with a graph showing the number of users connected throughout the network, and on the right, a “Pizza” style graph with the proportion of these users per PPPoE hub. And yes, it is also compatible with Mikrotik (even if you still use Winbox or whatever to manage it).
Below, we also have information regarding the addressing of clients on the network. Made4Graph brings us very important data on the proportion of users with CGNAT IPv4 (RFC6598) or with public IP addressed in the CPE, in addition to IPv6. This data is of great value, especially for those who are deploying IPv6 on the network, guaranteeing and helping the future of the Internet.

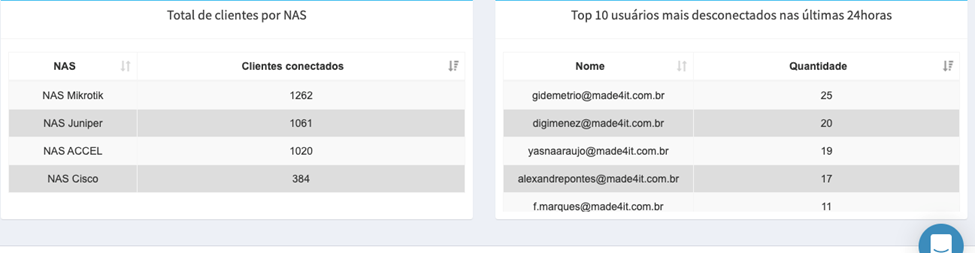
Scrolling down a little further, we have the exact number of clients registered per NAS (or BRAS/BNG/Access Concentrador, that is, whatever you prefer to call your authentication equipment) in addition to a “top 10 users disconnected in the last 24 hours”.
In the report of disconnected customers, Made4Graph presents the customers that most disconnected in the last 24 hours, already delivering users who are possibly having problems to the support and level 1 of the ISP. We know that customers with a large number of disconnections and reconnections in a short period of time is a strong indication of problems in the CPE or involved, giving the possibility for support to be proactive in these critical customers (getting in touch, already opening a ticket for verification, etc. ) which increases the end customer’s confidence in the ISP’s availability and delivery quality. Imagine you as an internet user noticing that your internet is disconnecting frequently and out of nowhere you receive a call from support saying that you noticed this requesting your authorization for a verification. It’s really quite a draw for the ISP.
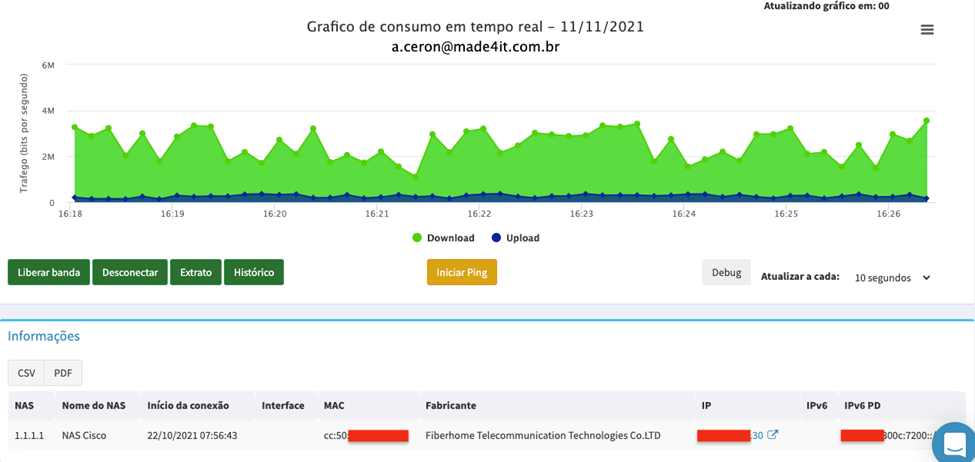
One of the most used features of Made4Graph is the real time graph. With it, we can have real-time data on the end user’s bandwidth consumption in an intuitive graph and with action buttons such as “Release Bandwidth” and “Disconnect” the user. It is also possible on this screen to access a “Consumption History” of the referred customer. If you, for example, want to know what the user’s bandwidth consumption was in the last 24 hours, Made4Graph brings this possibility.
The action buttons are widely used by ISPs in their support/N1 that makes the first contact with the customer, since they allow to quickly and effectively diagnose common problems either with a “Ping” (Made4Graph can directly ping the end user on the verification screen) or freeing up the user’s bandwidth so that he can fully test the “throughput” of his connection, already showing any possible bottleneck in the network.
On the same screen, a little further down, we also have information about the TR069 module. For ISPs that implement Made4Graph with support for TR069 (and that have their CPEs managed by it) we have a general overview of the user’s CPE with data such as physical port status, wireless signal strength, devices connected to the router, among other information.


Made4Graph is not limited to a graph visualization tool. We have a dedicated section for “reports” where, with his ability and overview of the network, he manages to bring data of great value to the ISP’s operational body. One of the most used by support staff is the “Lost Carrier” report. Here, Made4Graph reports an overview of users disconnected in a given time interval due to loss of communication between the NAS and the CPE at the customer’s home.
We know that customers disconnected by “Lost Carrier” are often a strong indication of network instabilities, and having data from these users allows for a more predictive and proactive action by the ISP.

Made4Graph is a great piece of software to help ISPs manage their access users better, not being restricted by manufacturer or protocol, as it is compatible with the main brands in the market and with PPPoE and IPoE, while unifying the management of users from across the ISP. It eliminates the need to configure access users and passwords on routers, interact with them via command lines and the like, reduces the complexity of the operation and verification of end users and brings data that allow more predictive and proactive actions with access clients. . Aligned with the TR069, it guarantees facilities in the management of the users’ CPE where a “reset” of a router or ONT is no longer a reason to move a technician to the user’s home since the management and configuration can be completely done remotely by their support team already in contact with the customer via communication tools. Made4Graph’s goal is to be the best technical support tool for ISPs customer support including end-to-end customer visibility, problem resolution, auto provisioning and automation support.
It’s software made for ISP by people who understand ISP.
You can access our demo version and learn a little more about our software
– Gabriel Henrique, Network Analyst at Made4IT, has been working with technology and ISPs for over 10 years.