

Hello,
Here are this week’s news and updates for our Netflow Traffic Analysis Software, Made4Flow:
Dashboard – Total Traffic

With the new Dashboard you can get an overview of the Inbound (Download) and Outbound (Upload) traffic of your infrastructure.
Interface-by-Interface Chart
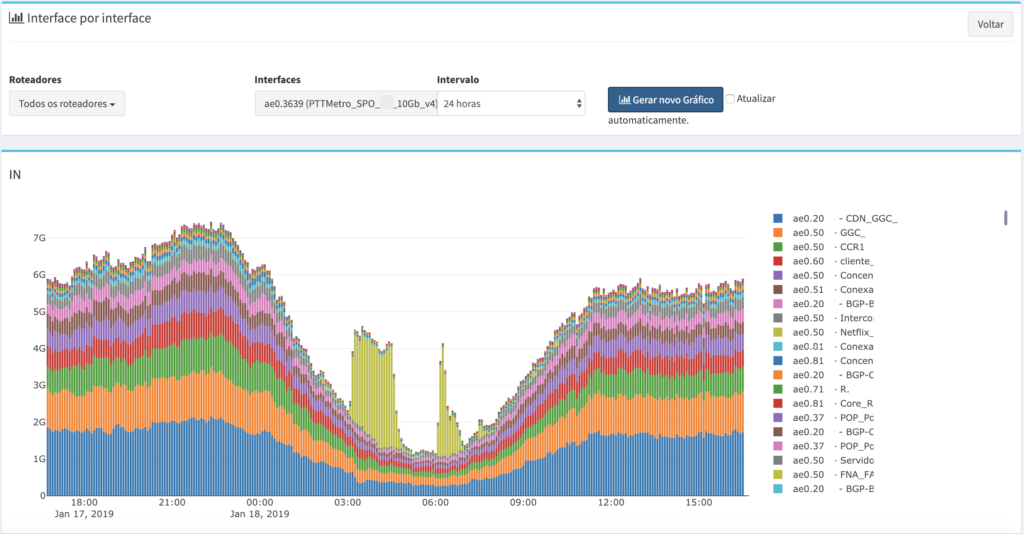
With this new graph it is possible to identify to which interface the traffic was destined, thus helping to know how much traffic your Network or ASN Client consumed from a circuit.
Filters on the Raw Data Report

With the Raw Data Report filters it is now possible to filter traffic from only one IPv4 or IPv6, Port, ASN or any other field within the report.
Multiple Routers
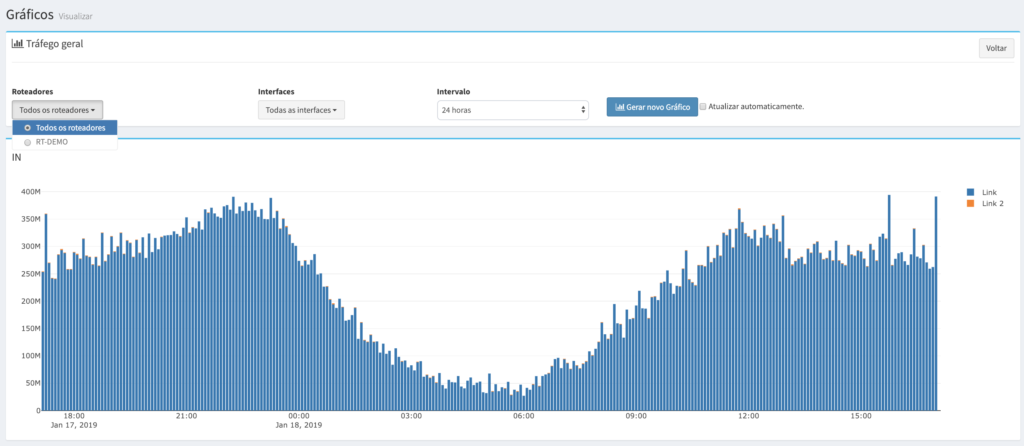
Now you can view information from all your routers from a single graph, helping you to know your traffic more quickly.
You can select multiple routers in all the Charts.
And they were also updated
- Search field in all Prefix, ASN and Interface filters
- In the Graphics legend the SNMP Alias information was added
- Improved performance of graphics over a 24-hour time interval
- Backend Software Update
See you next time with more news!